Tech Stack
Project Overview
Customer churn represents one of the most critical challenges faced by subscription-based businesses. This project focuses on building a robust machine learning system capable of predicting churn and identifying high-risk customers before they leave.
The solution covers the full data science lifecycle—from data ingestion and cleaning, to model training, evaluation, deployment, and visualization. The final output is an interactive dashboard that enables actionable, probability-driven decision-making.
Impact: The system enables proactive retention strategies by transforming historical customer data into predictive insights.
Decision Rationale
- Framed churn as a risk prediction problem rather than simple classification
- Prioritized probability outputs over hard labels to enable tiered intervention
- Chose evaluation metrics aligned with business cost of churn, not accuracy alone
- Selected models balancing performance, stability, and explainability
- Designed the system as a deployable product, not a notebook-only analysis
Full Thought Process
Click to expand full thought process
1. Framing the Problem (Why This Project Exists)
The first step was to clearly define the business problem, not the technical one. Customer churn represents lost revenue, and in subscription-based businesses, retention is often cheaper than acquisition. The objective was therefore not just to classify churn, but to predict churn risk early enough to enable intervention.
Key decisions at this stage:
- Treat churn as a binary classification problem (Yes / No)
- Prioritize probability outputs over hard labels to support risk-based decision making
- Build a solution that is deployable, not just analytically correct
This framing influenced every subsequent choice: metrics, model type, and dashboard design.
2. Understanding the Data (Before Touching Any Code)
Before cleaning or modeling, the dataset was examined conceptually:
- What does each column represent from a customer lifecycle perspective?
- Which fields are behavioral (tenure, services, billing)?
- Which are demographic?
- Which could realistically influence churn decisions?
At this stage, the dataset was recognized as:
- Mixed-type (categorical + numerical)
- Realistic but imperfect (whitespace issues, inconsistent labels)
- Rich enough to support meaningful modeling
This understanding prevented blind preprocessing and guided feature handling.
3. Data Cleaning Philosophy (Minimal but Correct)
Rather than aggressive transformations, the guiding principle was: Fix what is wrong, preserve what is meaningful.
Key issues identified:
- Hidden whitespace and control characters (e.g. "No\r")
- Inconsistent categorical formatting
- Numeric fields stored as strings
- Potential target leakage if identifiers were not removed
Actions taken:
- Strip whitespace and hidden characters from all categorical columns
- Convert numeric columns explicitly and coerce invalid values
- Drop identifier fields (customerID) from modeling
- Preserve original categorical semantics (e.g. Fiber Optic vs DSL not merged)
The intent was to clean without distorting the real-world meaning of the data.
4. Exploratory Data Analysis (EDA as Hypothesis Testing)
EDA was not treated as visualization for its own sake, but as a way to test assumptions about churn.
Each EDA question followed this structure:
- What behavior might increase churn?
- Does the data support or contradict this idea?
Examples:
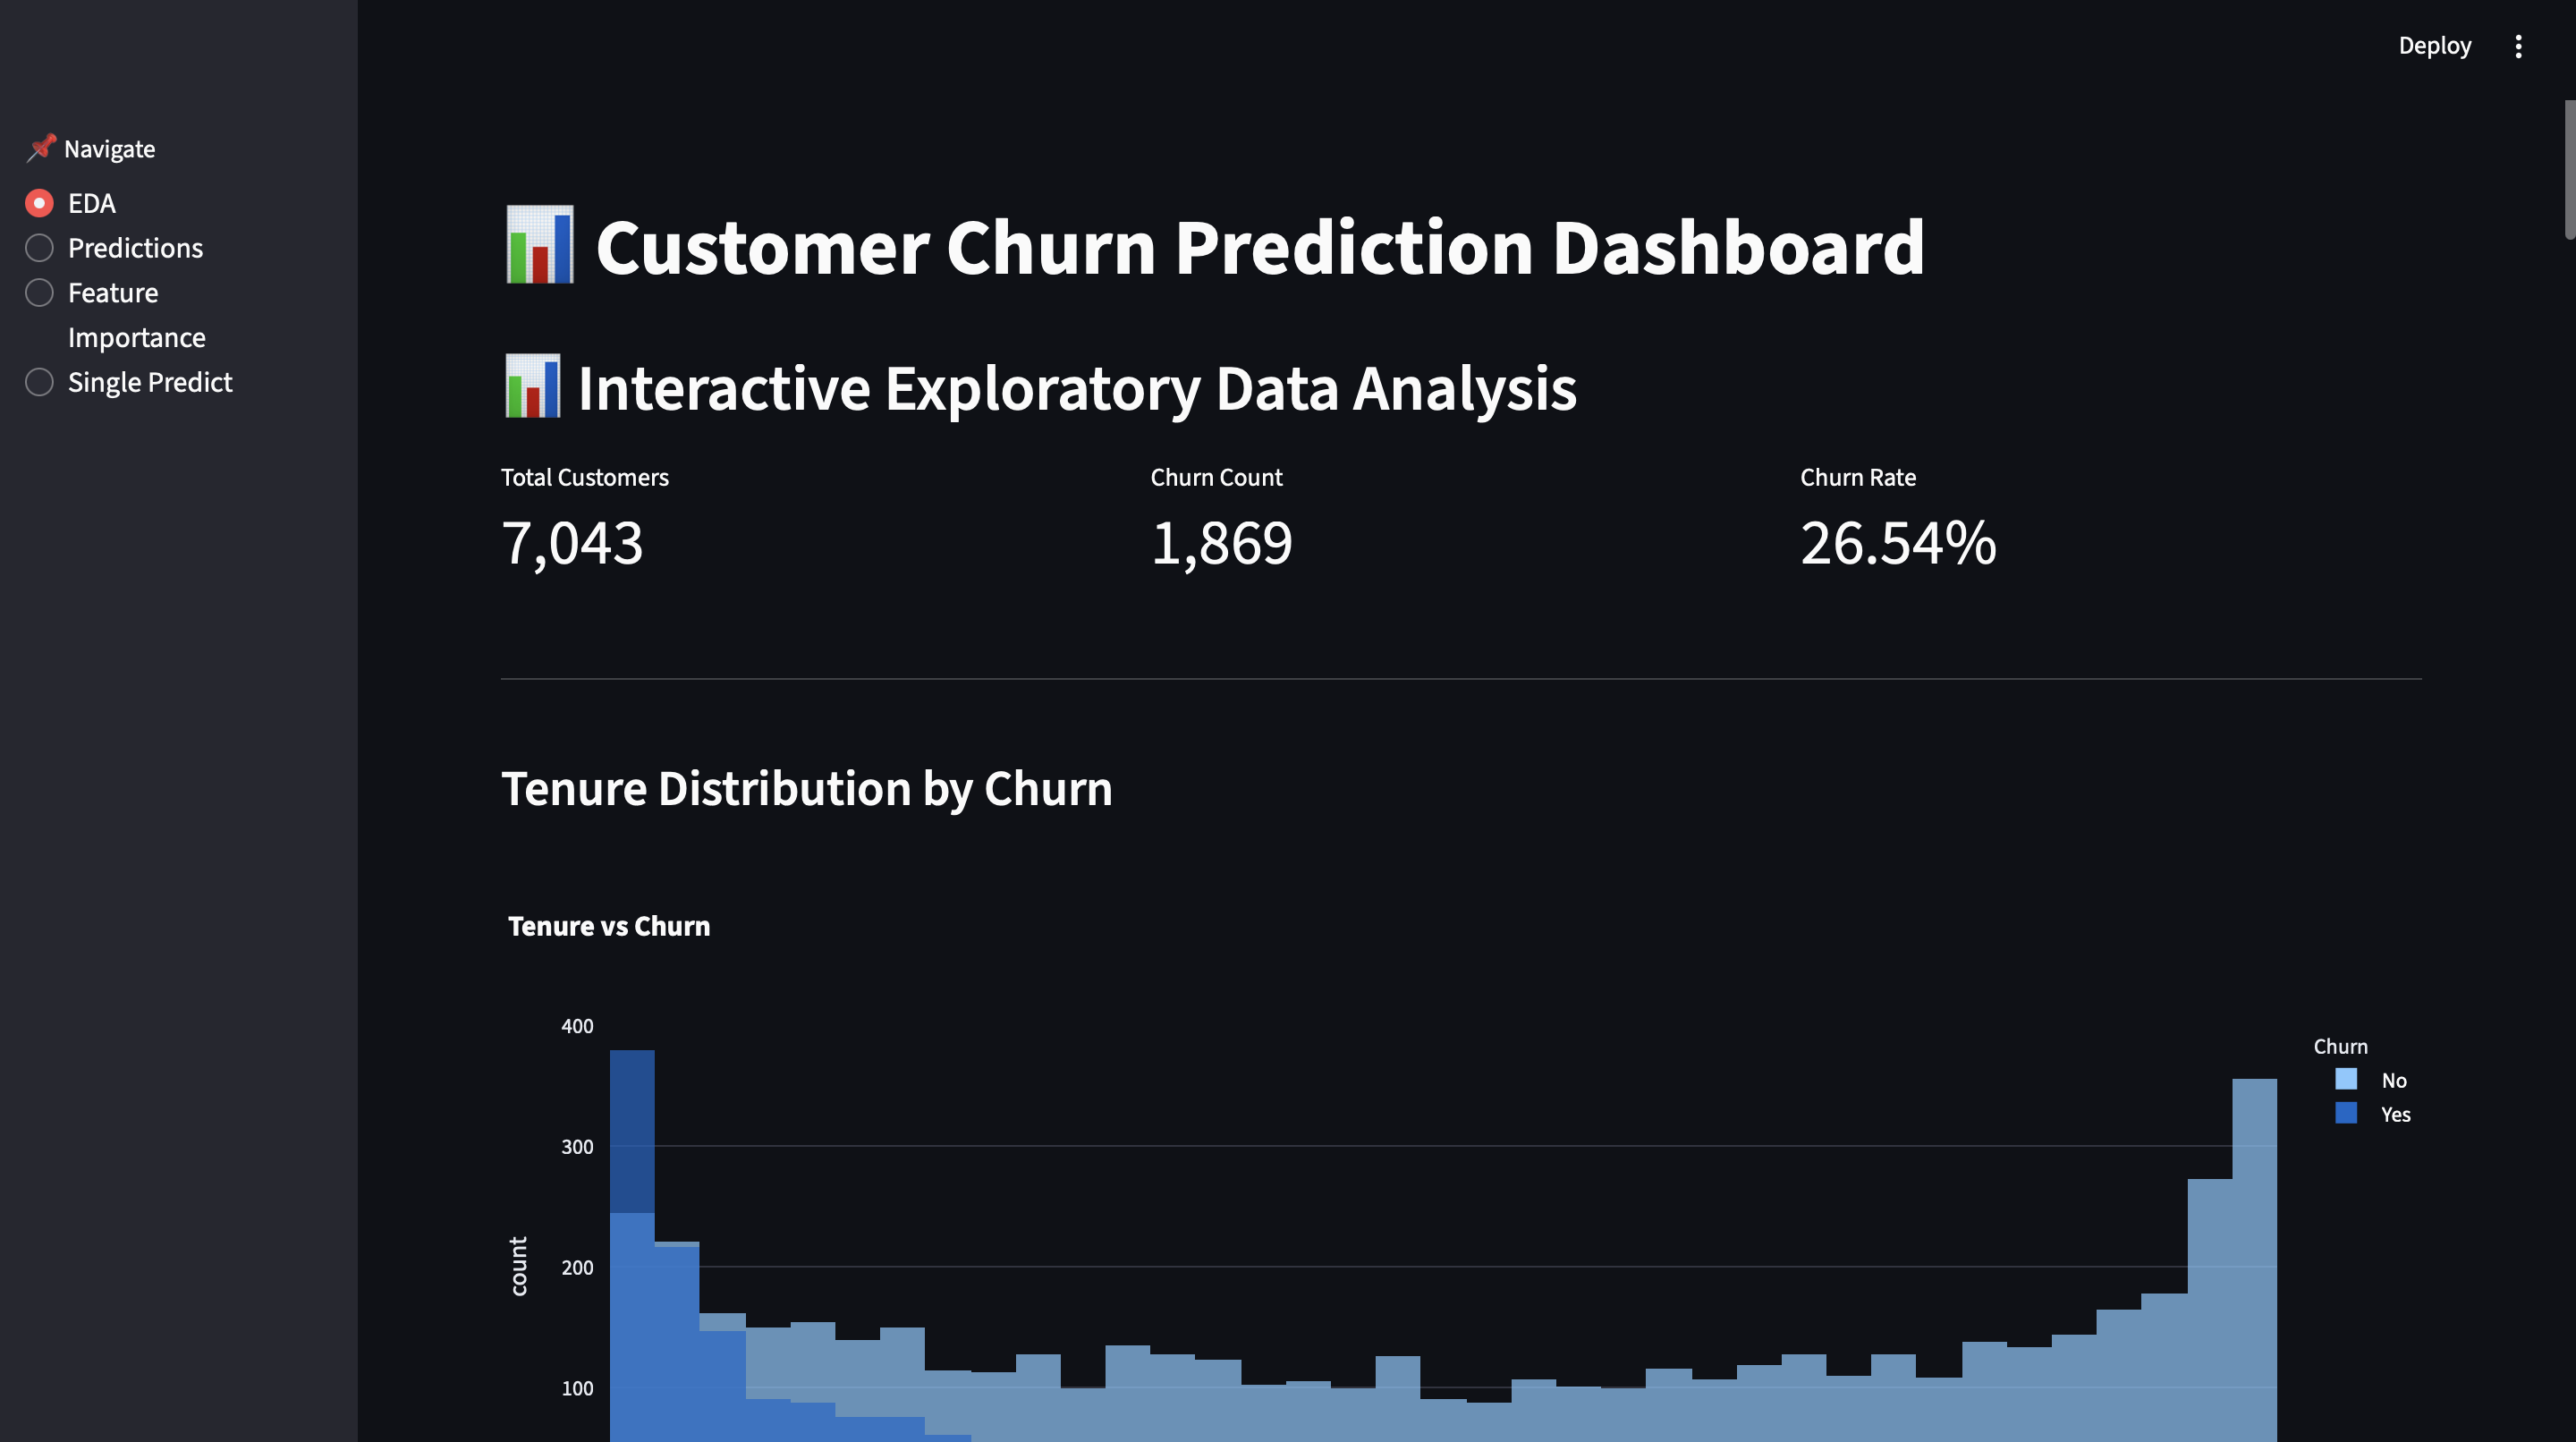
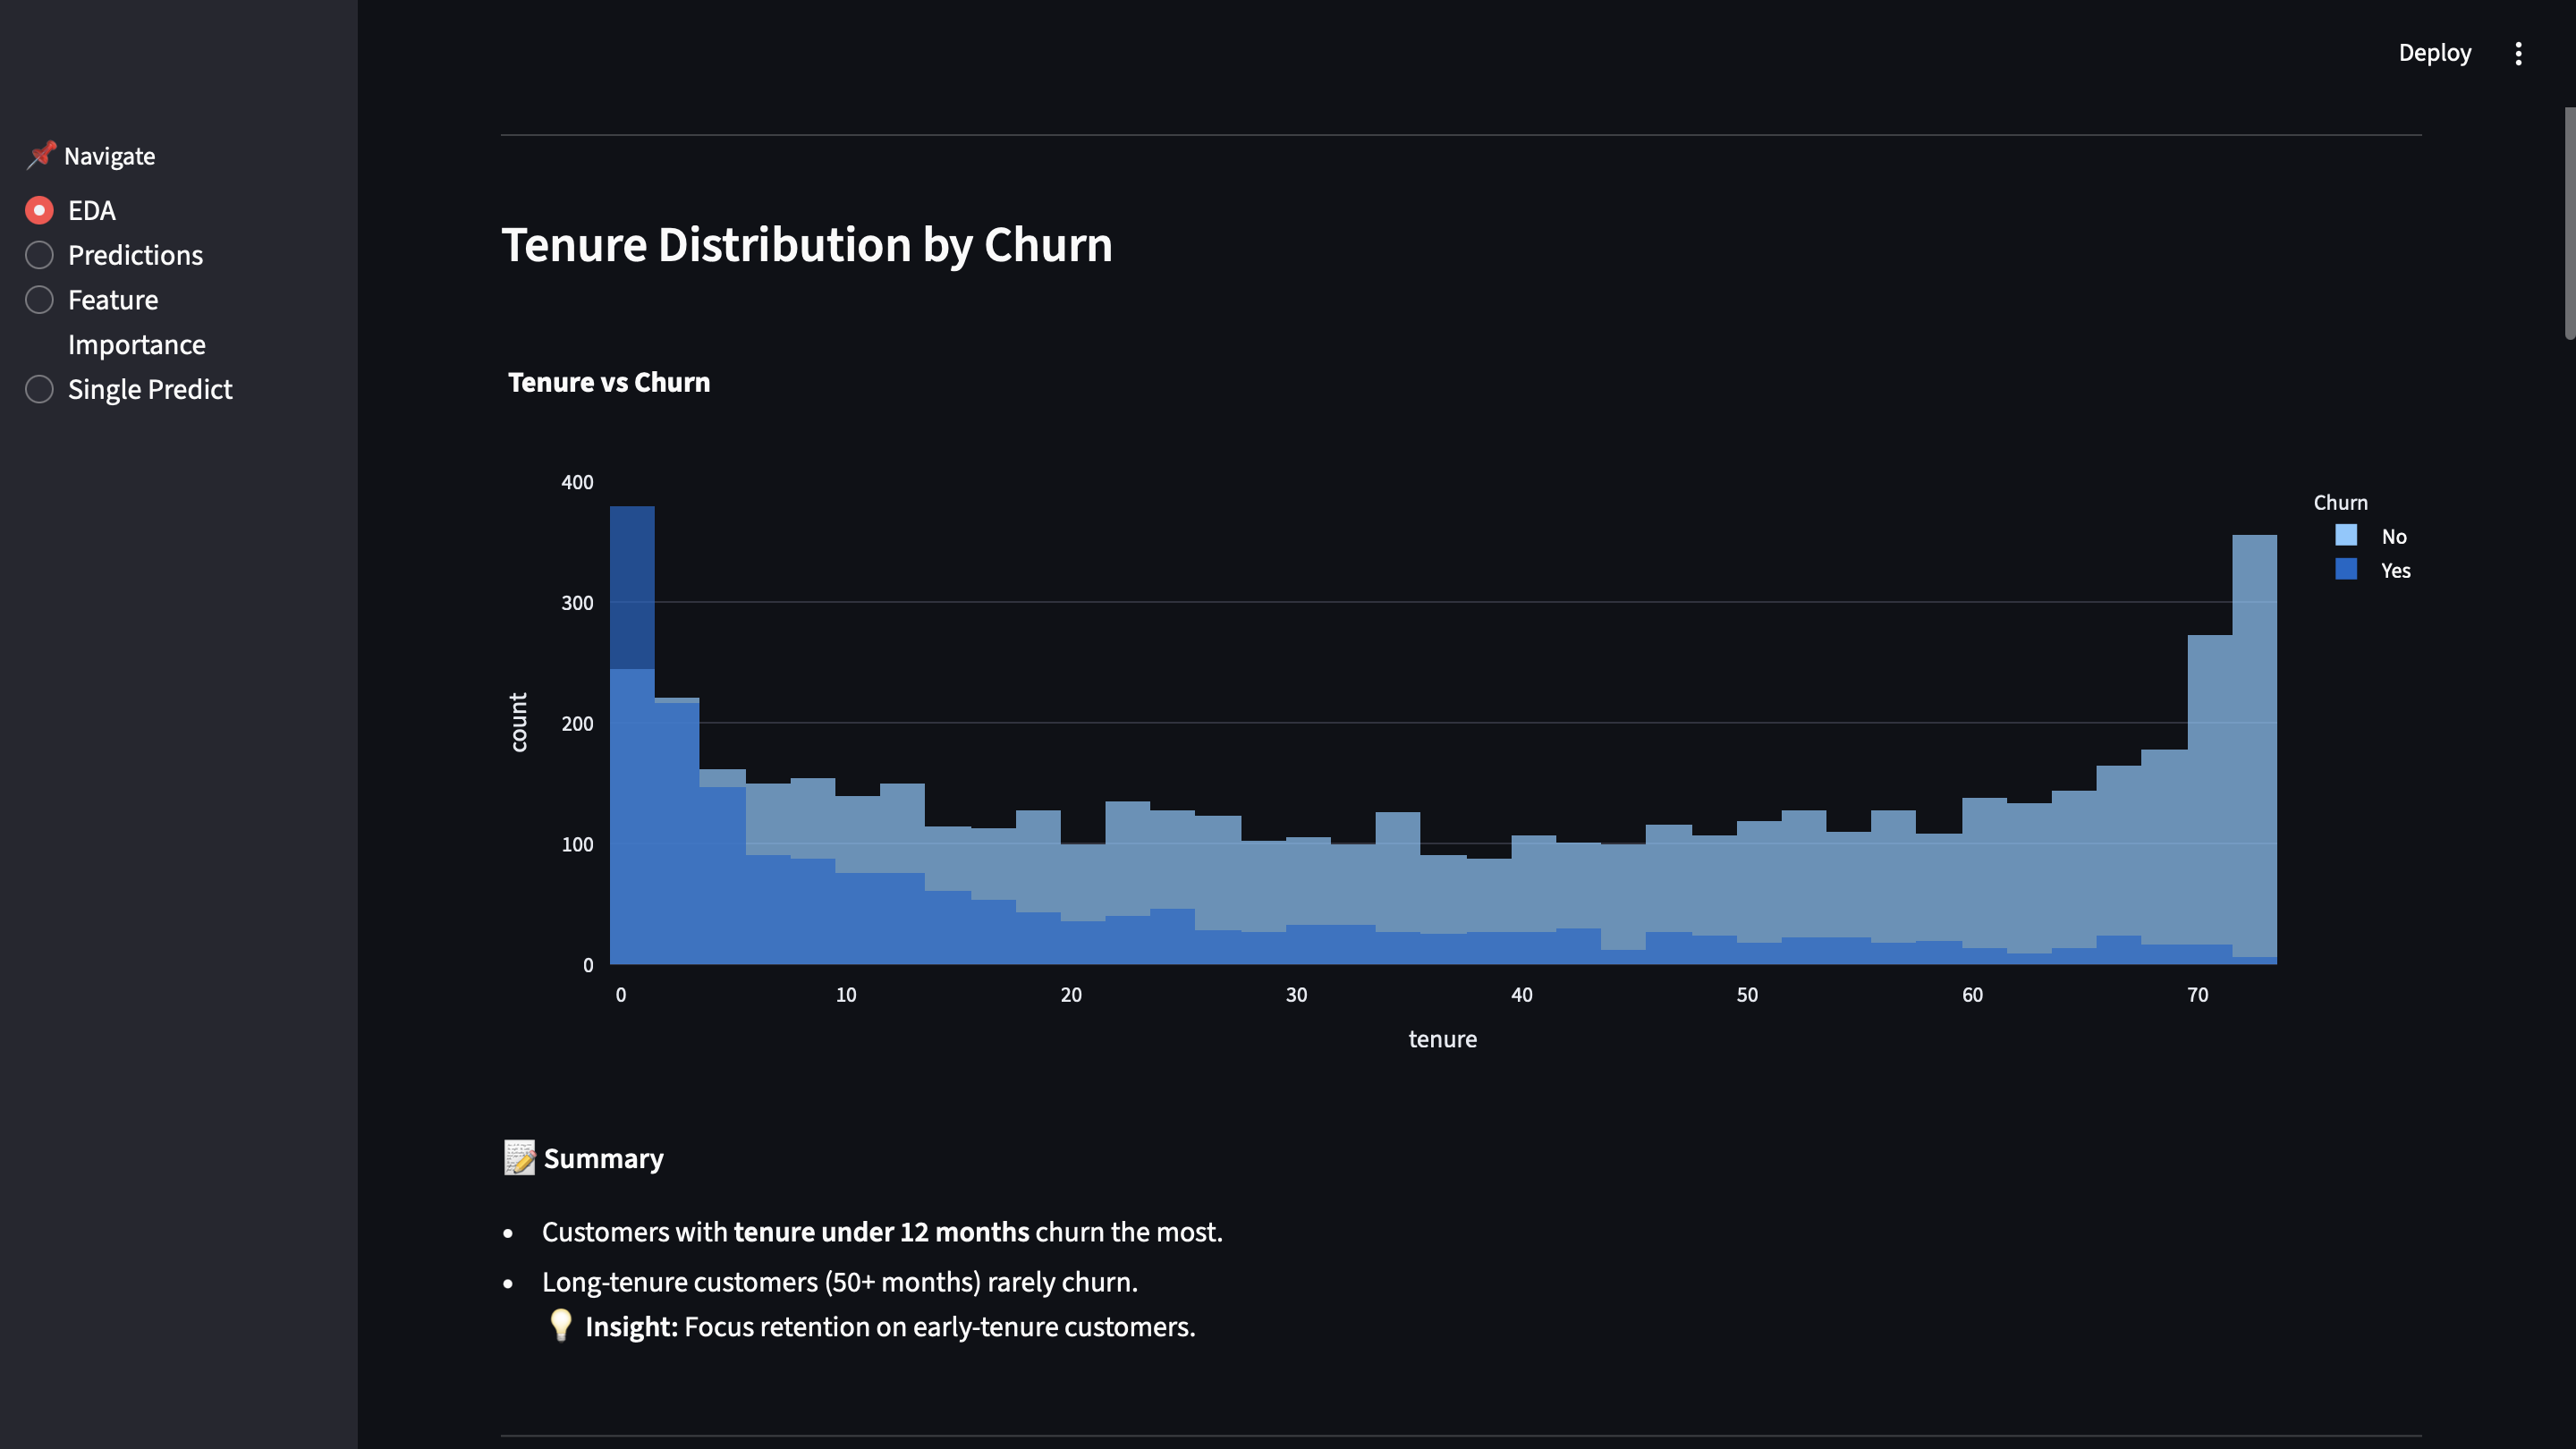
- Tenure: New customers are more likely to churn → confirmed
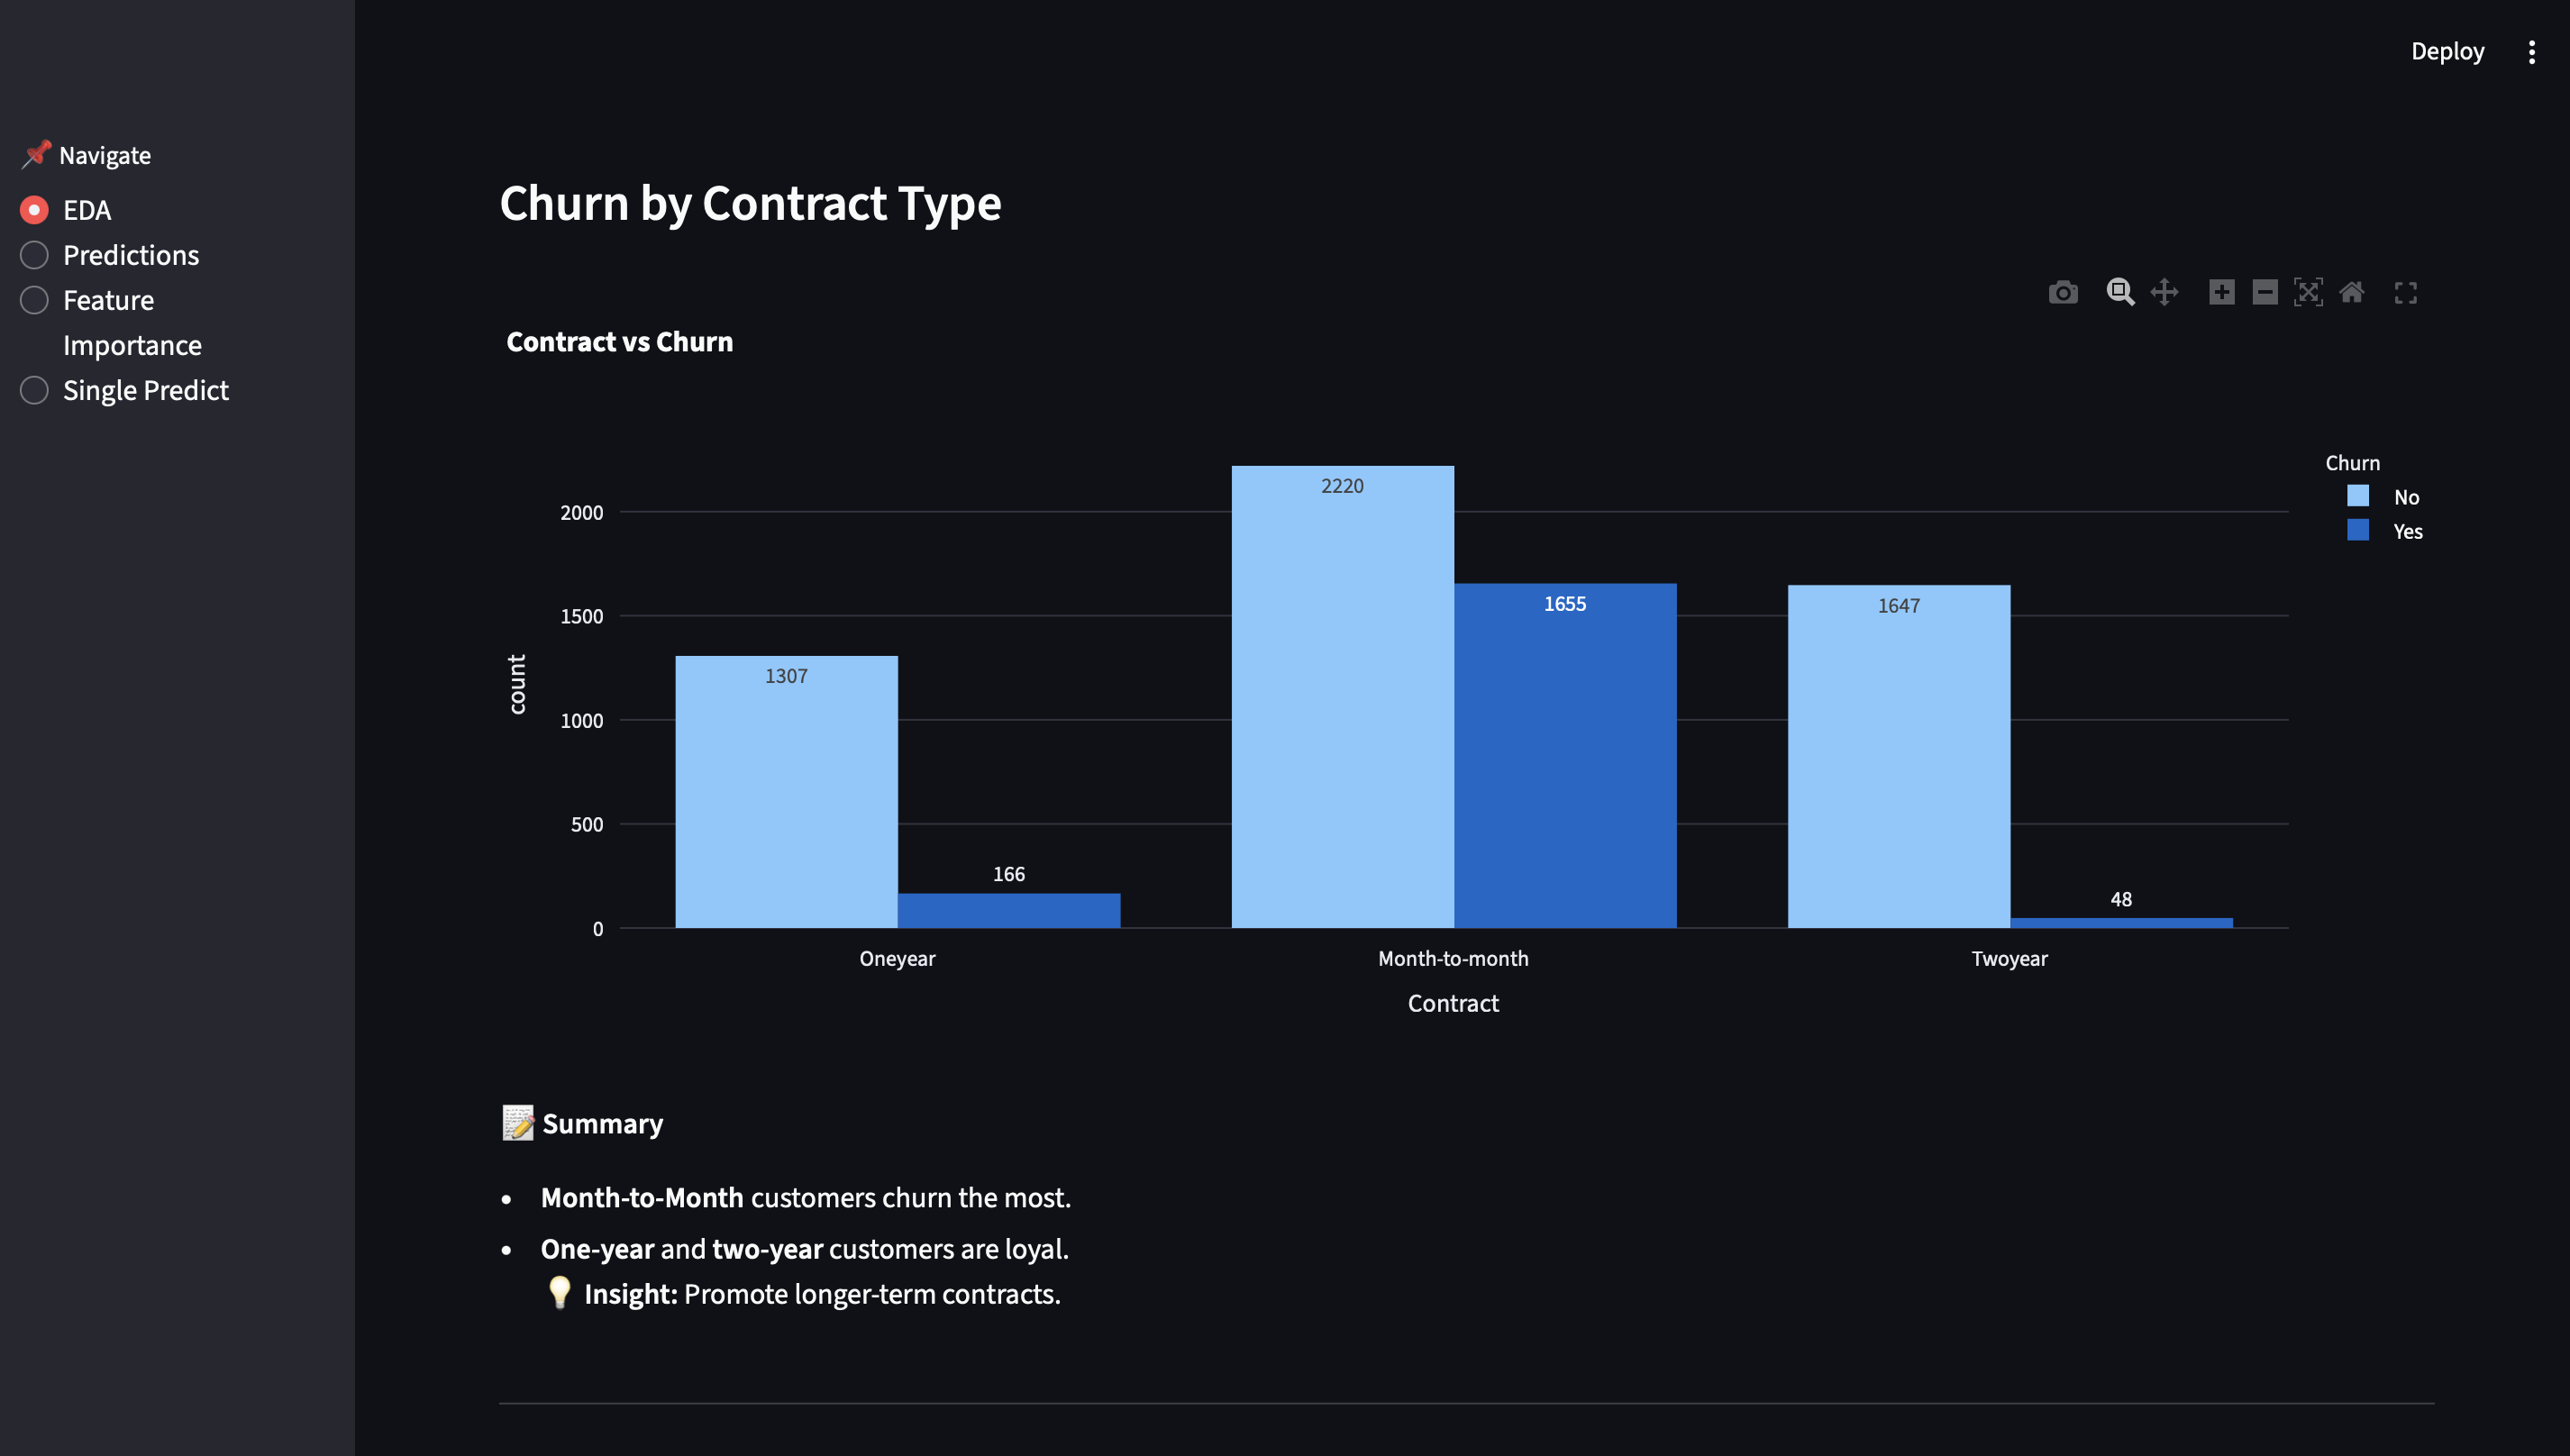
- Contract type: Short-term contracts imply lower commitment → confirmed
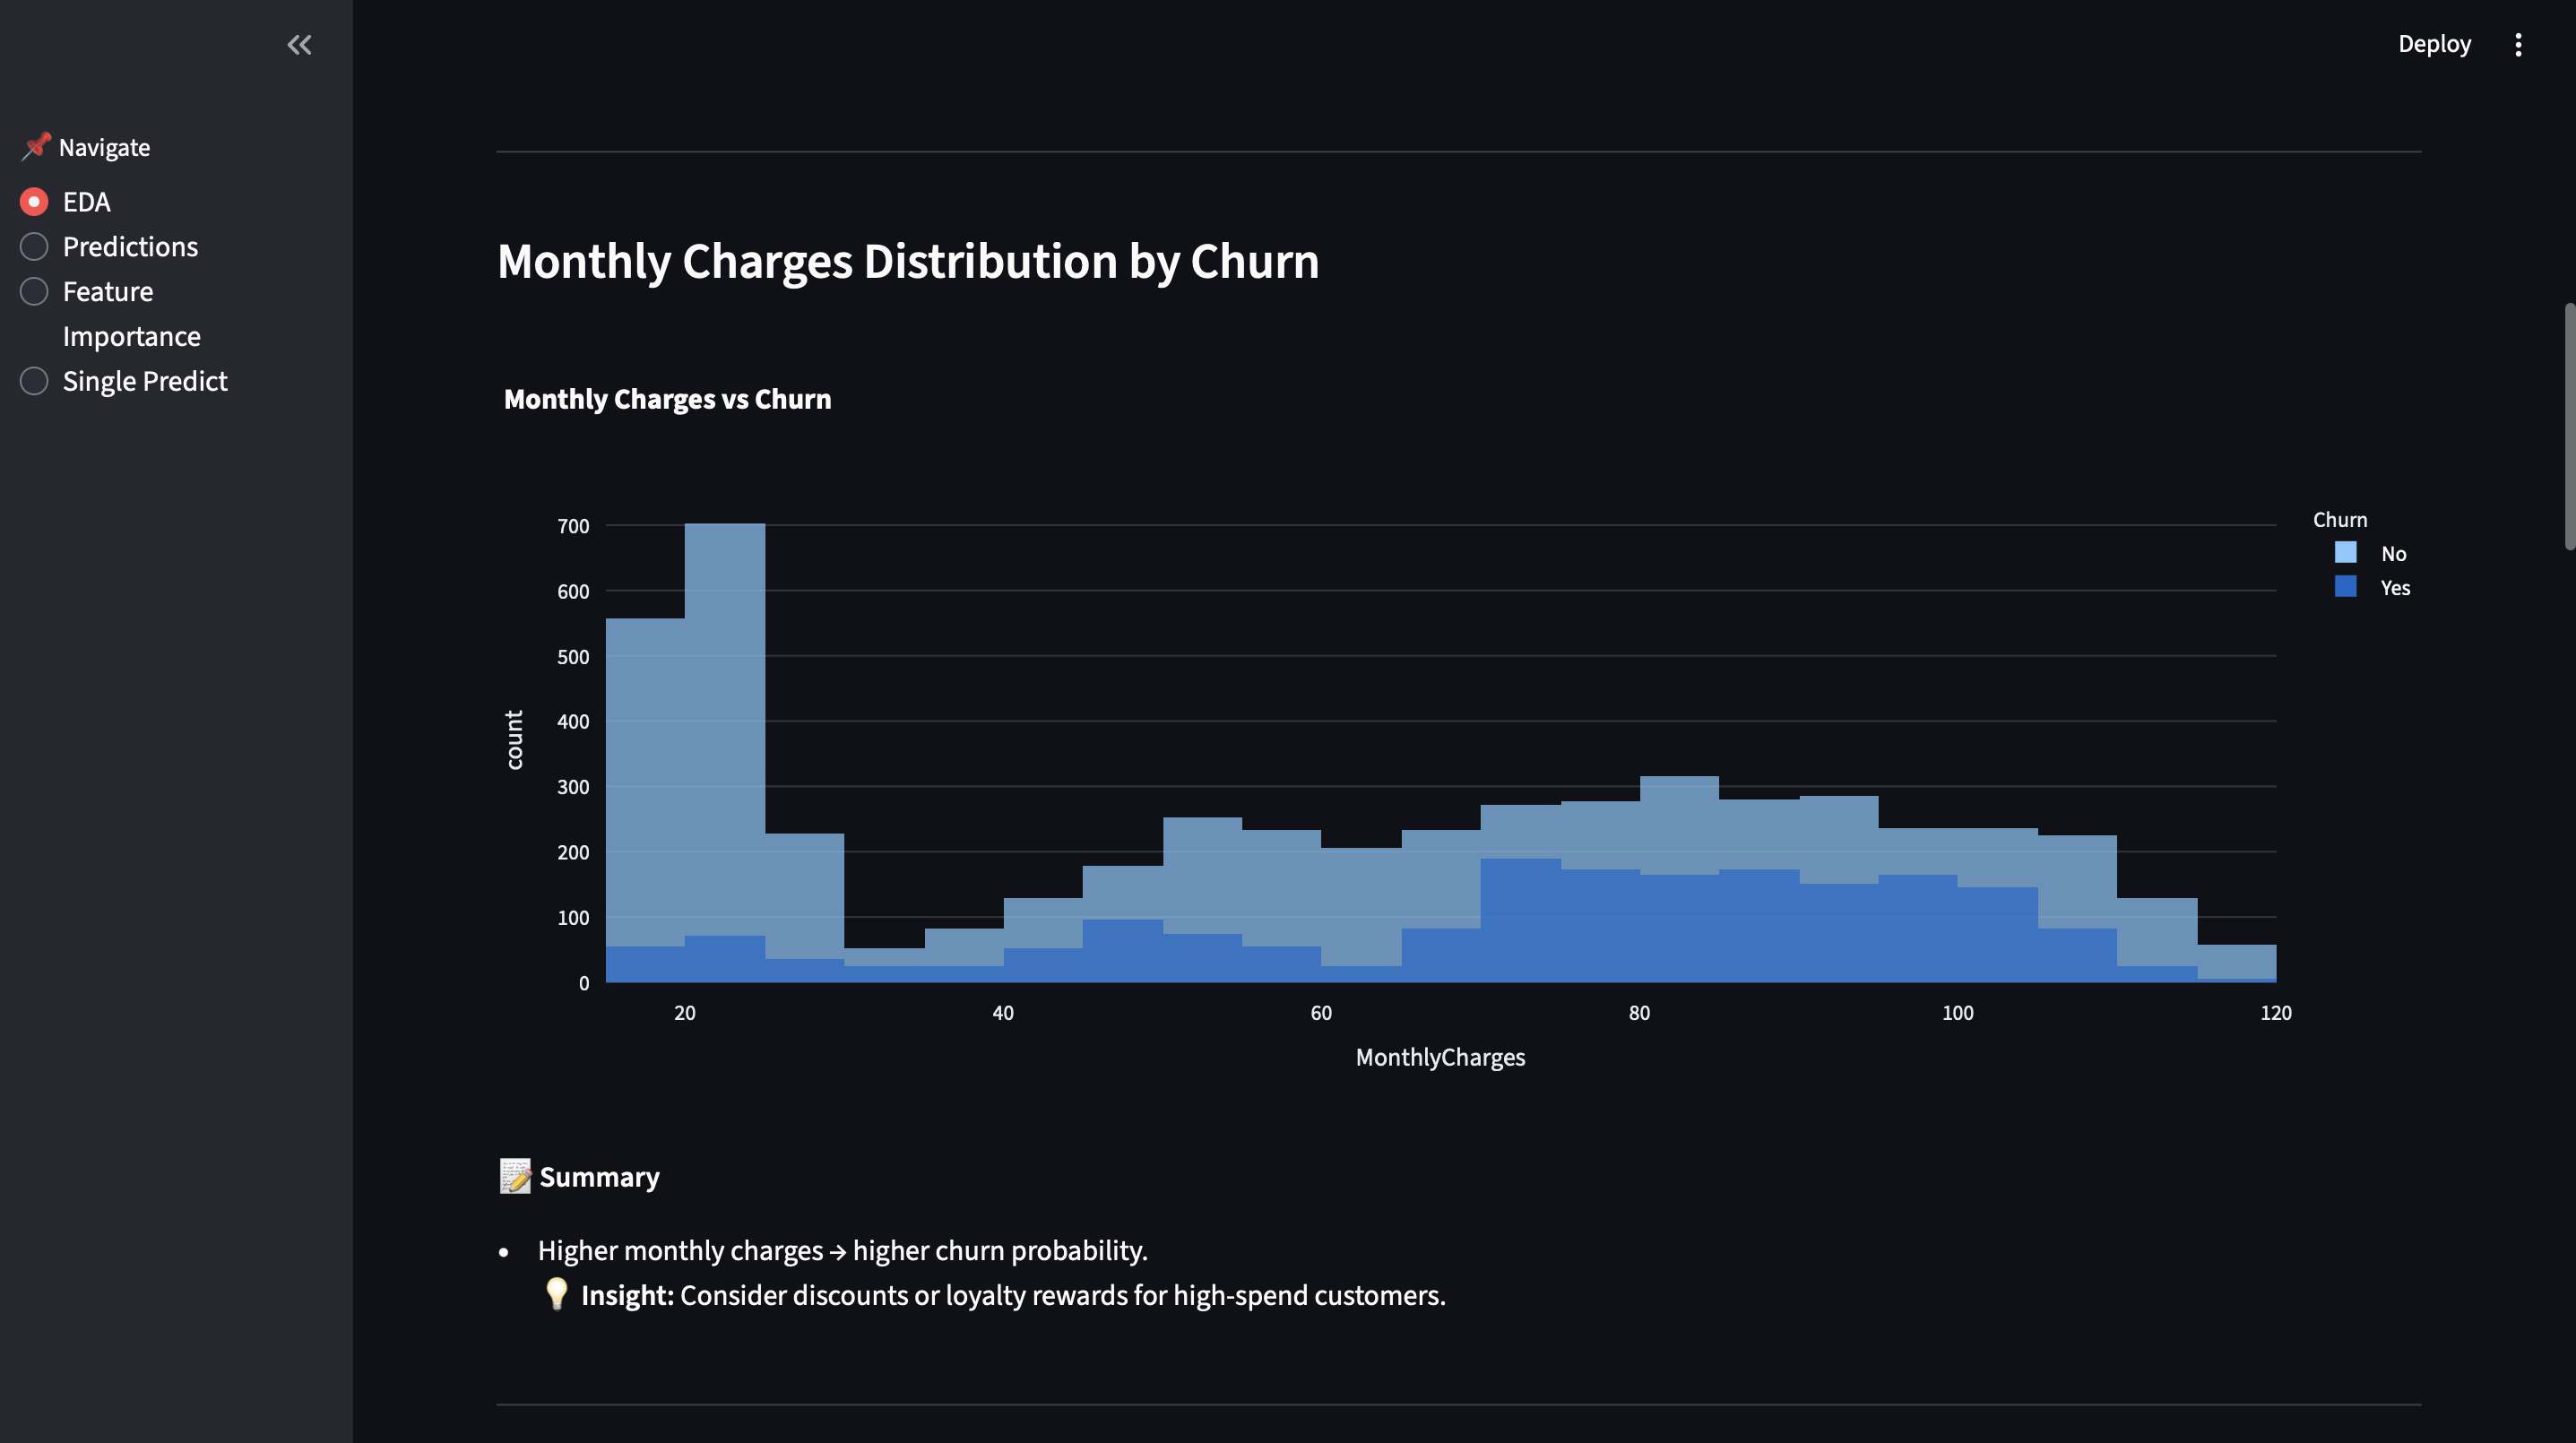
- Monthly charges: Higher cost increases dissatisfaction → confirmed
- Internet service type: Fiber customers show higher churn → confirmed
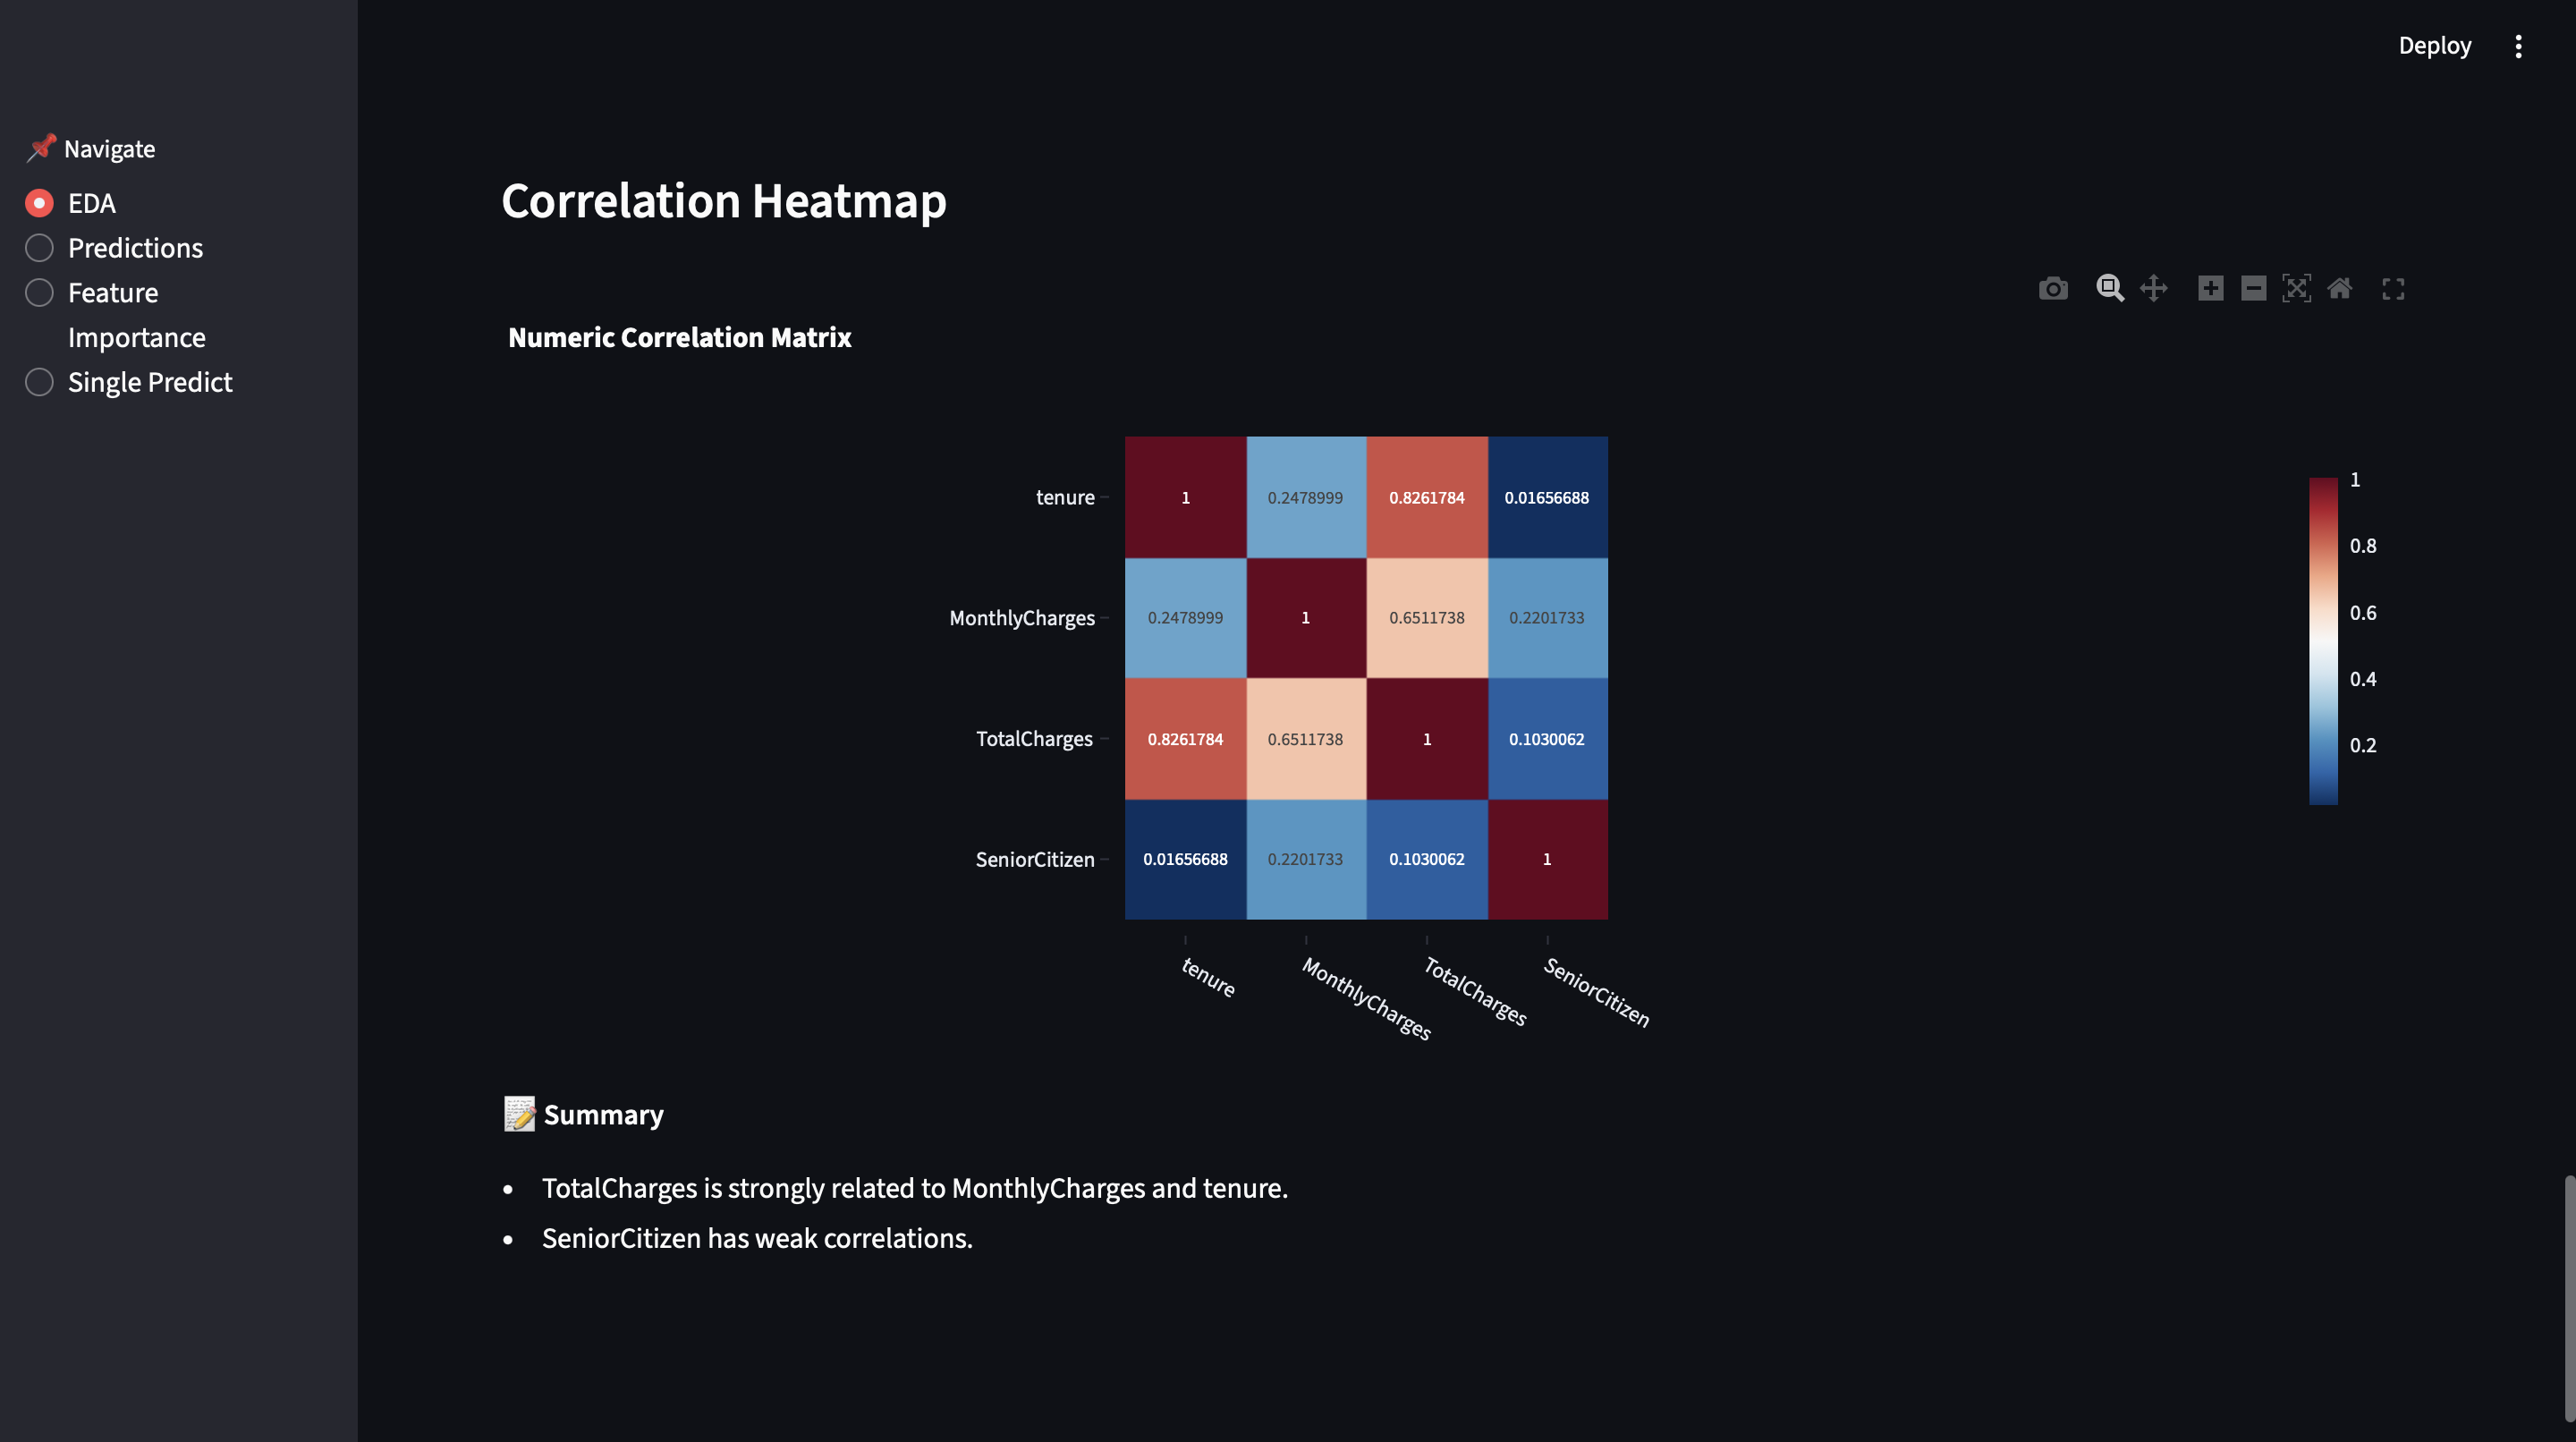
Correlation analysis was used only to:
- Validate numeric consistency
- Detect redundancy
- Confirm no obvious data errors
EDA directly informed expectations for modeling but did not hard-code decisions into the model.
5. Feature Engineering Strategy (Restraint Over Complexity)
The dataset already contained meaningful features, so the approach was: Avoid unnecessary feature invention unless there is strong justification.
Key decisions:
- One-hot encode categorical variables
- Avoid ordinal encoding for nominal categories
- Preserve binary indicators as 0/1
- Exclude the target and identifiers strictly
No synthetic features were added because:
- Tree-based models can learn interactions naturally
- Over-engineering risks noise amplification
This ensured the model learned from authentic customer behavior, not artificial constructs.
6. Model Selection Reasoning (Why These Algorithms)
Multiple algorithms were tested to balance interpretability, performance, and robustness:
- Logistic Regression: Baseline model, interpretable coefficients, benchmark for performance comparison
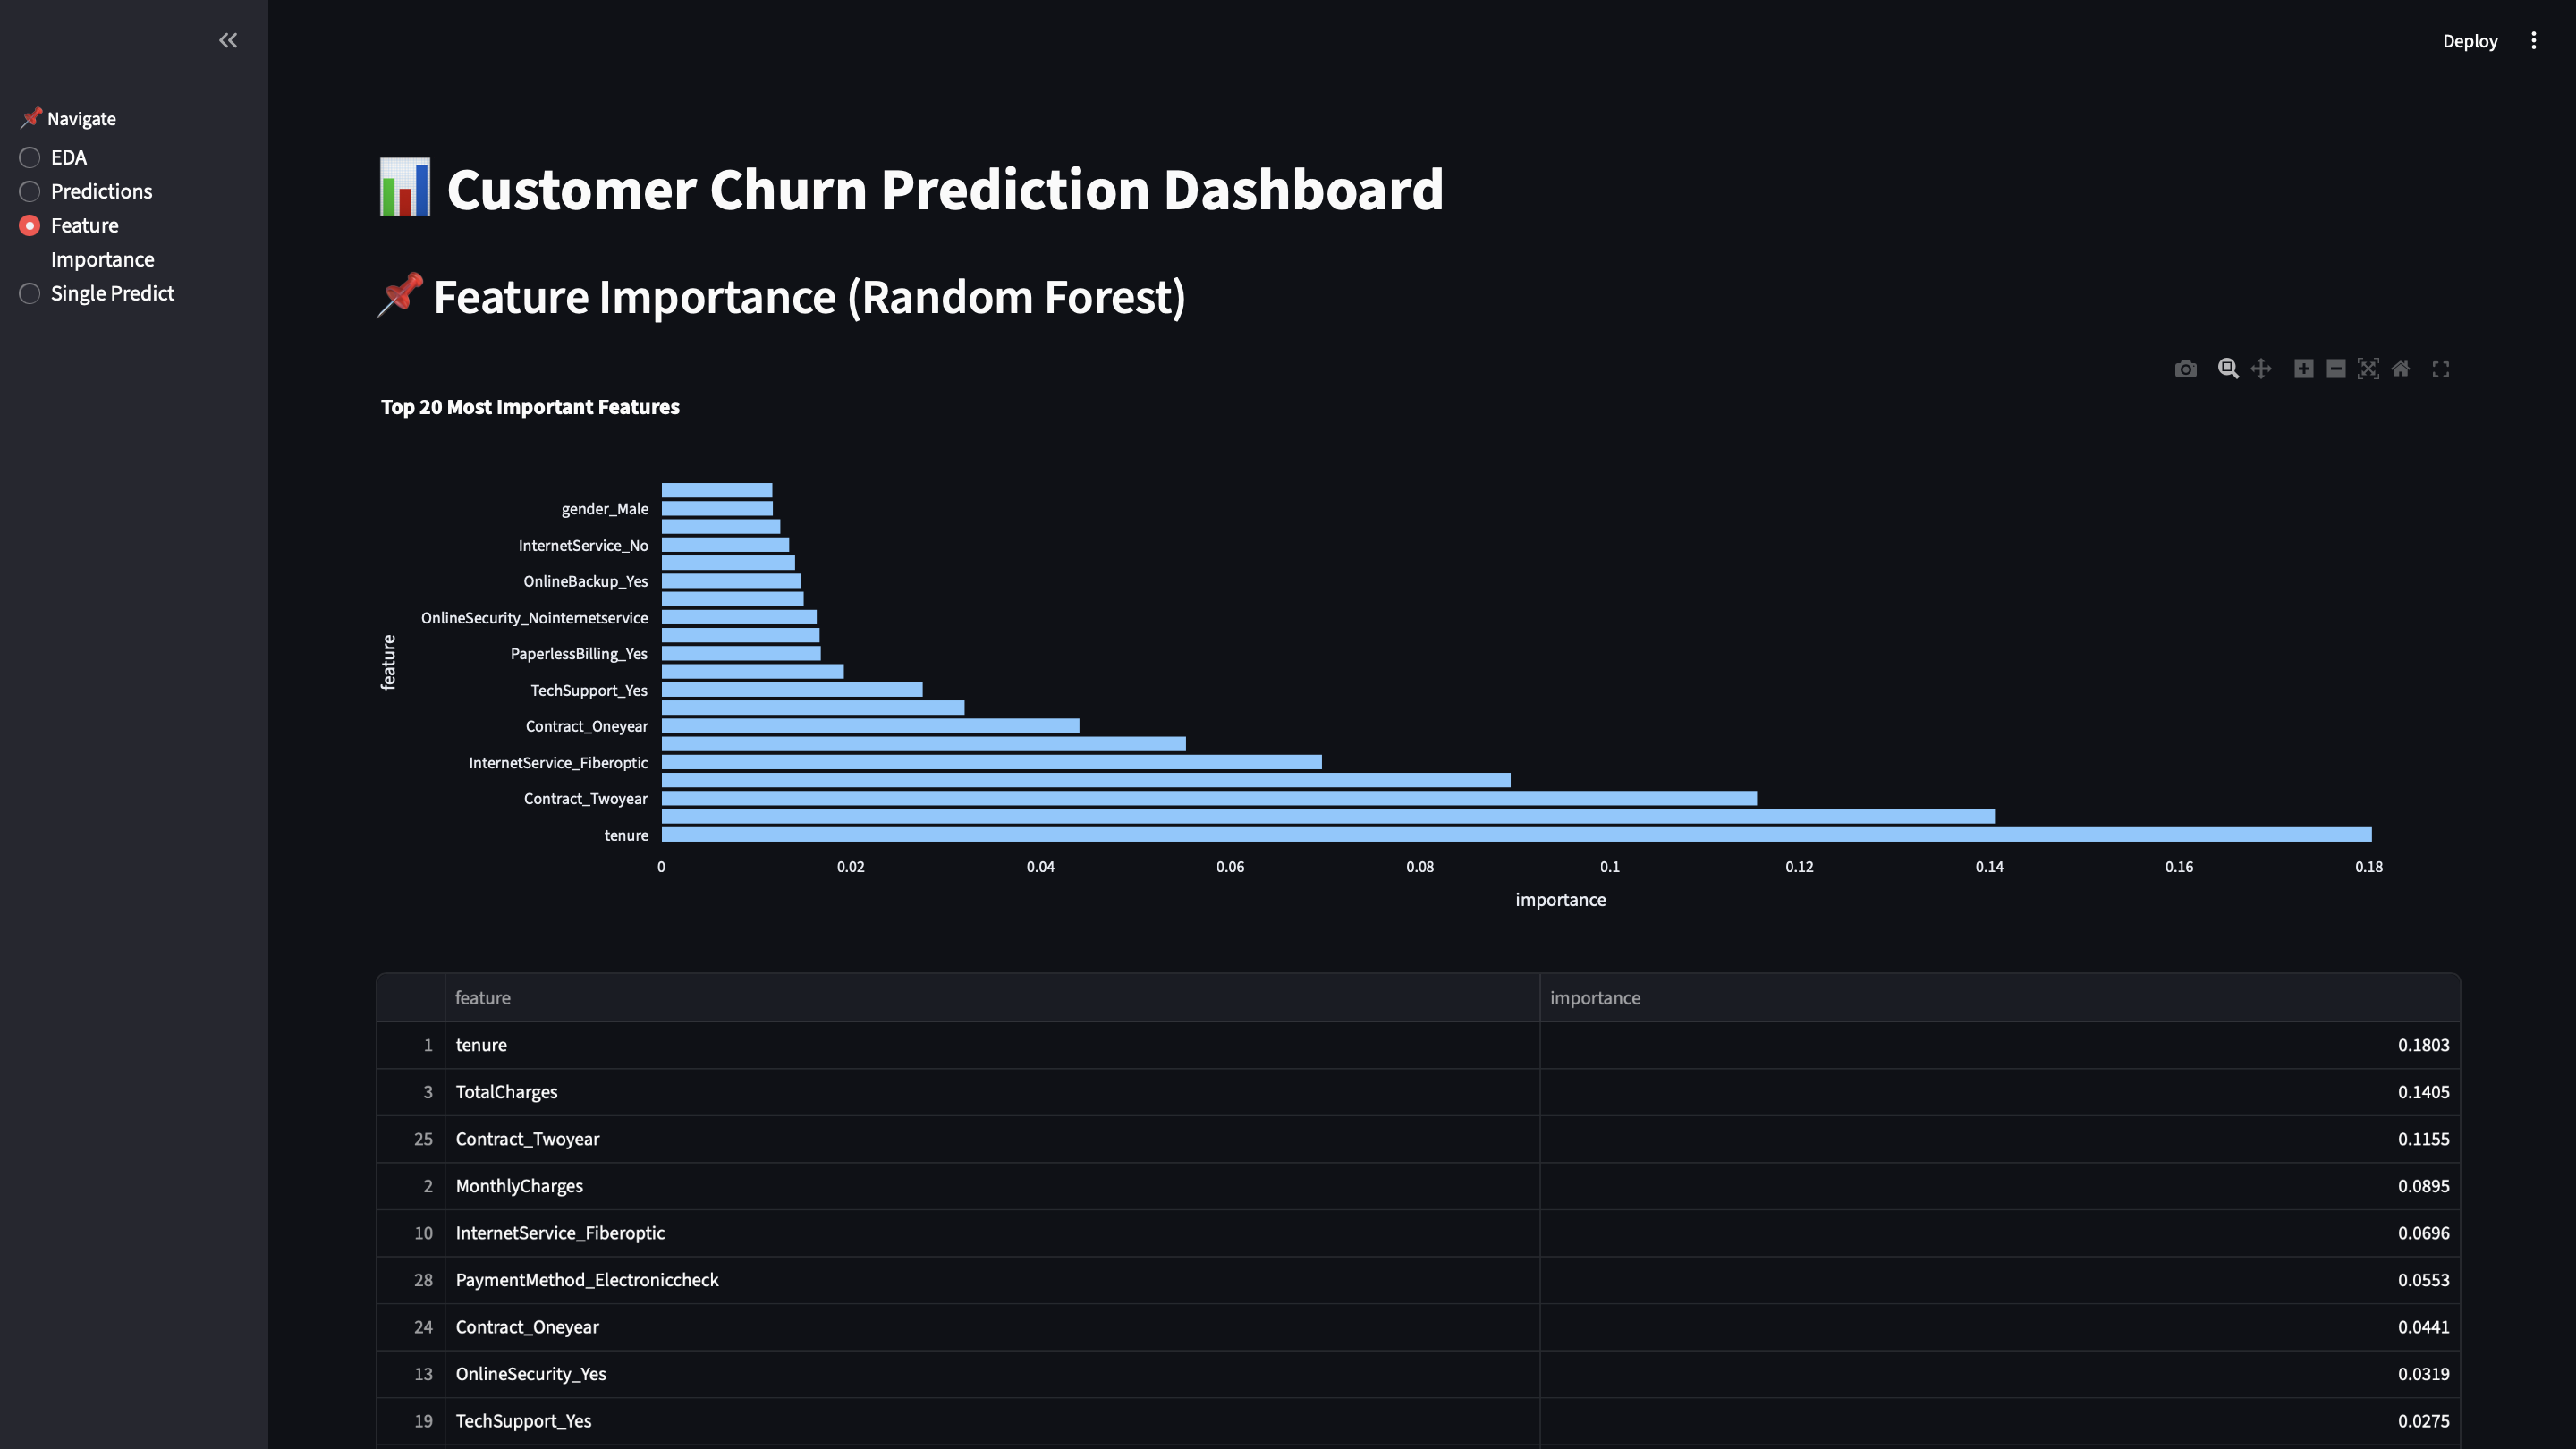
- Random Forest: Handles nonlinear interactions, robust to noise, provides feature importance
- Tuned Random Forest: Optimized depth, trees, and splits; balanced recall and precision better than baseline
- XGBoost: High-performance gradient boosting, tested for comparison, not defaulted blindly
The final model was chosen not solely on accuracy, but on:
- ROC-AUC
- Recall on churn class
- Stability
- Explainability
This reflects real business constraints, not leaderboard optimization.
7. Evaluation Philosophy (Metrics That Matter)
Accuracy alone was explicitly rejected as insufficient due to class imbalance.
The evaluation focused on:
- ROC-AUC: overall discriminatory power
- Recall (churn class): missing a churner is costly
- Precision-Recall tradeoff: balance intervention cost vs benefit
Thresholds were treated as business levers, not fixed rules:
- Probabilities enable tiered risk classification
- High-risk vs medium-risk segmentation enables prioritization
This aligns the model with real operational use, not academic metrics alone.
8. Explainability as a Requirement, Not an Add-On
Feature importance analysis was used to answer: "Can we explain this prediction to a non-technical stakeholder?"
Top drivers such as tenure, contract type, and charges:
- Made intuitive sense
- Aligned with EDA findings
- Increased trust in the model
This step ensured the model could support decision-making, not just prediction.
9. Deployment Thinking (From Model to Product)
Rather than stopping at a trained model, the project was designed as a usable system.
Key design choices:
- Persist model and feature schema (.pkl)
- Store predictions in a database
- Separate training from inference
- Build a dashboard for consumption
The Streamlit dashboard was intentionally designed to:
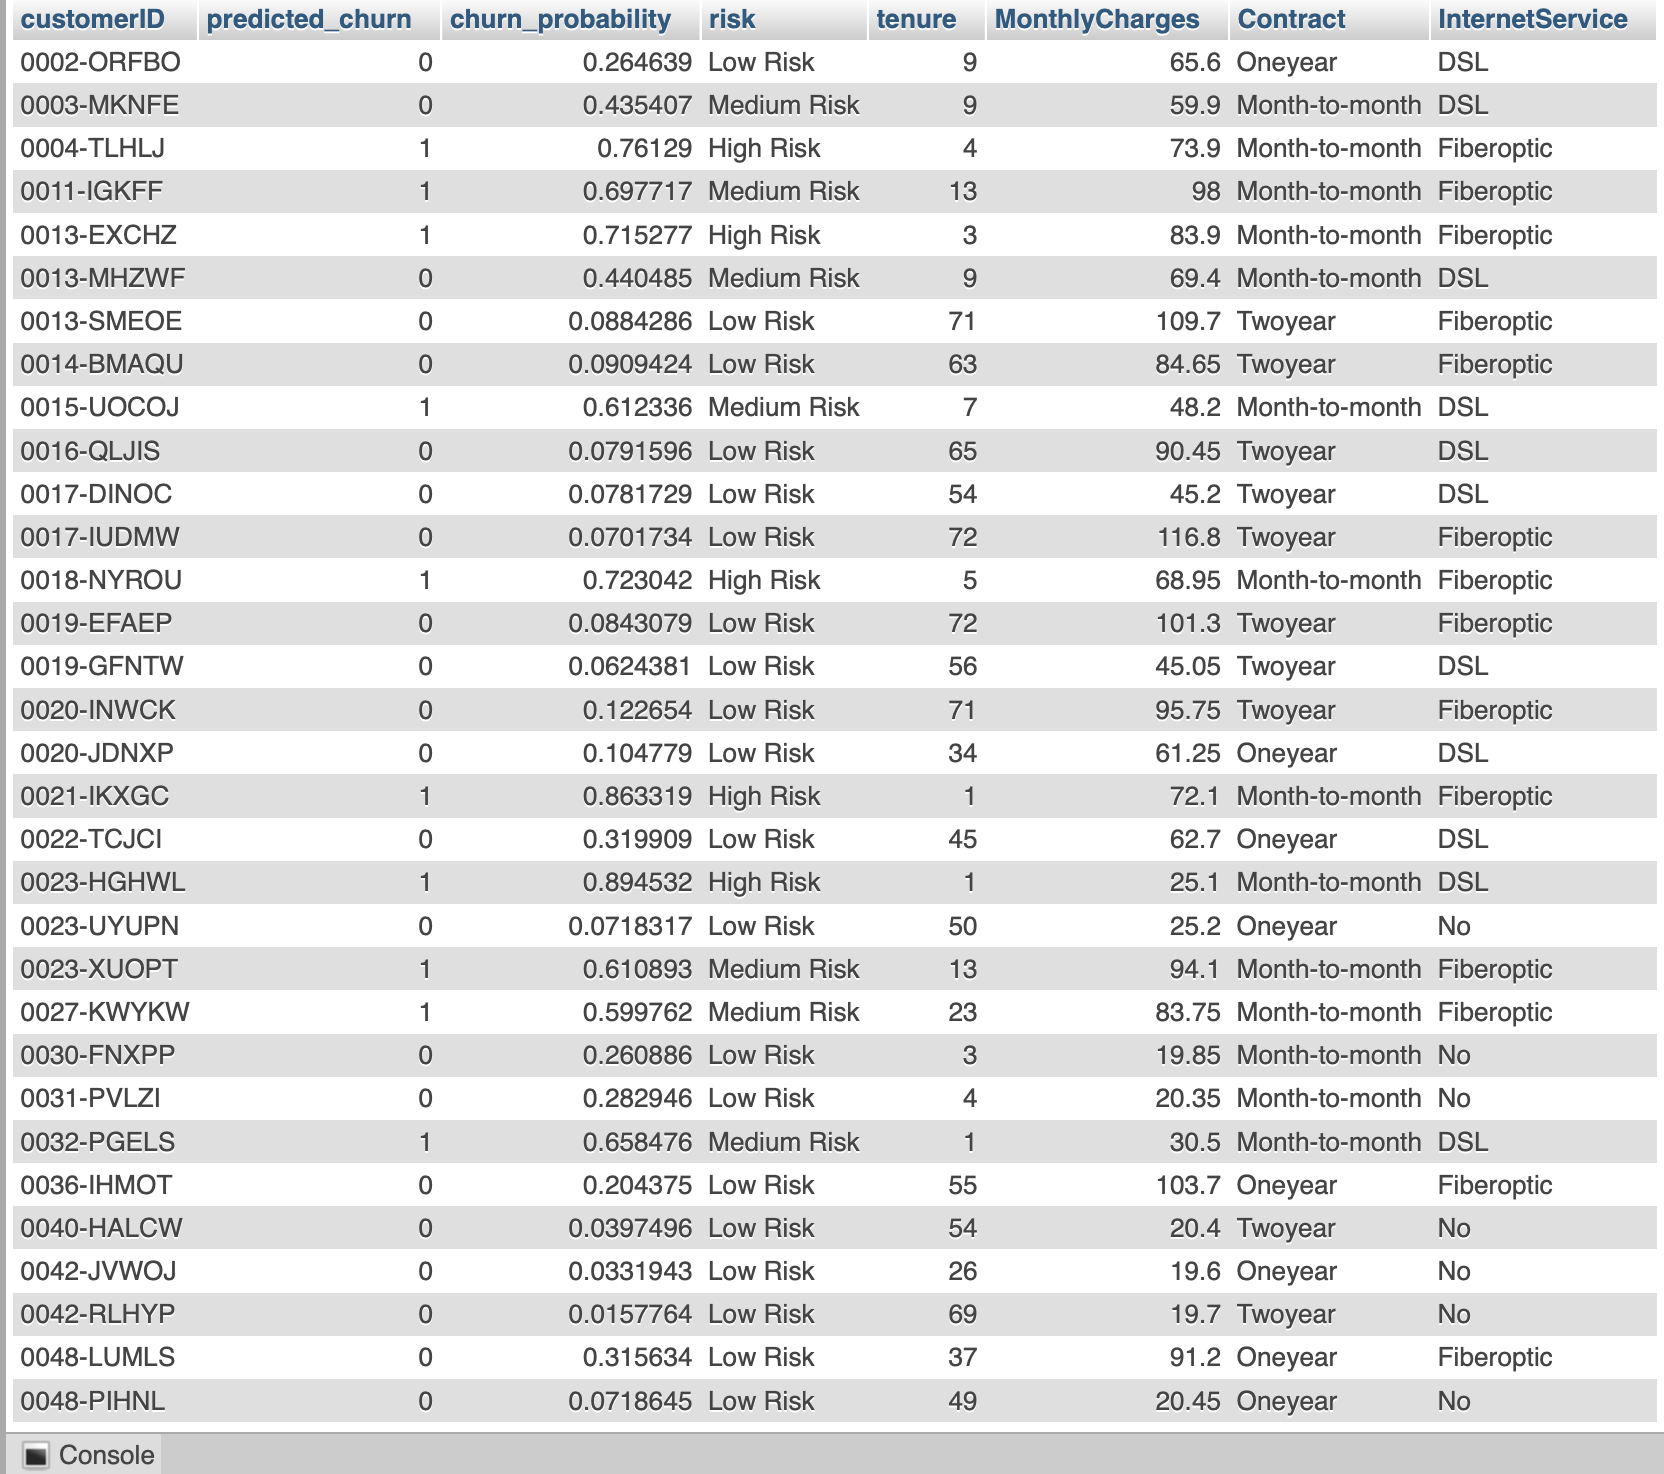
- Show probabilities, not just labels
- Rank customers by risk
- Support exploration, not overwhelm users
This transformed the project from analysis into a data product.
10. Dashboard Design Philosophy (Clarity Over Density)
The dashboard design followed these principles:
- Start with KPIs → context before detail
- Visualize patterns before tables
- Summarize insights beneath charts
- Allow drill-down for advanced users
EDA, predictions, feature importance, and single-customer prediction were separated to avoid cognitive overload.
This mirrors professional BI and ML product design.
11. Reflection on Trade-Offs
Every decision involved trade-offs:
- Simpler models vs maximum performance
- Interpretability vs complexity
- Flexibility vs automation
The final system favors:
- Reliability
- Explainability
- Business relevance
- Maintainability
These priorities reflect real-world data science, not just experimentation.
12. Overall Mental Model
The project was guided by a simple mental loop: Understand → Validate → Predict → Explain → Deploy
Each stage reinforced the others:
- EDA validated modeling choices
- Modeling confirmed EDA hypotheses
- Explainability validated trust
- Deployment validated usefulness
Problem Definition
Exploratory Data Analysis
Exploratory Data Analysis was conducted to understand customer behavior patterns and uncover key churn drivers.
Modeling & Evaluation
Multiple machine learning algorithms were evaluated, including Logistic Regression, Random Forest, and XGBoost. Model performance was assessed using ROC-AUC, precision, recall, and F1-score.
A tuned Random Forest classifier was selected as the final model due to its strong performance, robustness to non-linear relationships, and interpretability.
Prediction Dashboard
A Streamlit dashboard was developed to operationalize the churn model. The dashboard allows users to explore data, view predictions, and identify high-risk customers in real time.
My Contribution
- Exploratory data analysis and insight generation
- Model training, tuning, and evaluation
- Dashboard development and system integration
Reflection & Learnings
This project reinforced the importance of building deployable data products rather than isolated models. Emphasis on data quality, interpretability, and business alignment proved essential.
Key Takeaway: Effective data science bridges analytics, engineering, and decision-making to deliver real-world impact.