Tech Stack
Project Overview
Predicting product reorders is a core problem in e-commerce demand forecasting, inventory planning, and personalization. This project focuses on predicting whether a specific user will reorder a specific product in their next order.
The system was designed to operate at scale, using SQL-first feature engineering on tens of millions of rows, followed by supervised machine learning and a constrained AI layer that translates model signals into executive-readable insights.
Key Principle: The machine-learning model produces predictions and statistical signals; the AI layer explains those signals without adding inference, causality, or recommendations.
Decision Rationale
- Framed reordering as a probabilistic prediction problem, not a rule-based task
- Used SQL-first modeling to handle scale and reduce memory pressure
- Prioritized explainability and stability over marginal accuracy gains
- Separated prediction from interpretation to avoid AI hallucination
- Designed the system to mirror real production analytics pipelines
Full Thought Process
Click to expand full thought process
1. Framing the Problem Correctly
The starting point was to define the problem at the right level of granularity. Rather than predicting whether a user will place another order in general, the task was framed as a user–product–level prediction: given a user’s historical behavior and a product’s reorder characteristics, can we estimate the probability that the user will reorder that specific product in their next purchase?
This framing reflects real e-commerce decisions such as demand forecasting, replenishment planning, and personalization, where the unit of interest is not the customer alone, but the interaction between a customer and a product.
Importantly, the goal was to produce probabilistic outputs, not hard labels, to preserve uncertainty and support downstream decision-making.
2. Understanding the Nature of Reorder Behavior
Before modeling, the problem was considered conceptually. Product reordering is not uniform behavior: some products are habitual (e.g. staples), while others are exploratory or occasional. Similarly, some users exhibit strong repeat-purchase patterns, while others do not.
This implies that reorder behavior emerges from the interaction of:
- User-level purchasing habits
- Product-level reorder tendencies
- Temporal signals related to recency and frequency
As a result, any viable model would need to capture both user behavior and product characteristics, rather than treating either in isolation.
3. Data Modeling Strategy (SQL-First by Design)
Given the size of the dataset (tens of millions of order–product records), feature engineering was deliberately performed in SQL rather than in-memory notebooks.
This approach allowed:
- Efficient aggregation across large tables
- Explicit control over joins and groupings
- Reduced memory pressure during downstream modeling
- Clear visibility into how each feature was derived
The data was structured into fact-style tables representing historical user–product interactions, with features designed to summarize past behavior without leaking future information.
Care was taken to ensure that all features were derived strictly from prior orders, maintaining temporal integrity.
4. Feature Semantics and Constraints
Feature design focused on behavioral signals that are meaningful and interpretable:
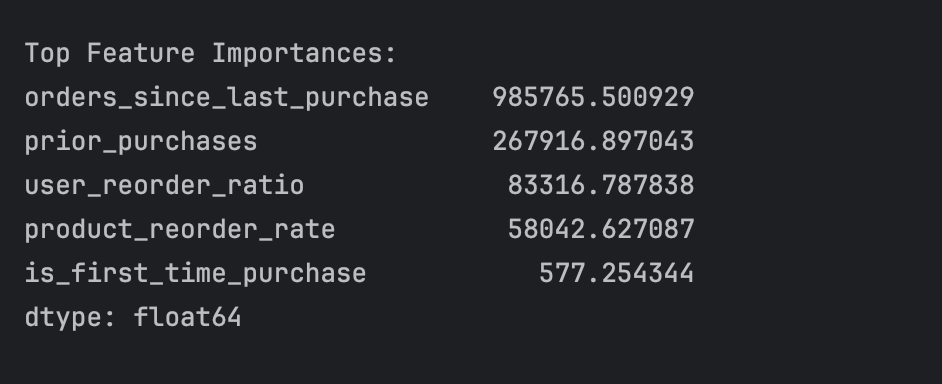
- How many times the user has previously purchased the product
- How recently the user last purchased it
- How frequently the user reorders products overall
- How often the product is reordered across all users
Missing values were treated as structural, not errors. For example, a missing “orders since last purchase” value indicates that a product has not been purchased before, which is itself informative.
The guiding principle was to preserve semantic meaning rather than aggressively imputing or transforming data.
5. Baseline Modeling and Expectations
A simple, interpretable baseline was established first to set expectations and validate the signal in the data. This helped answer an early question: does the data actually contain predictive structure for reordering?
Once this was confirmed, more expressive models were explored to capture non-linear relationships and interactions that simple linear models cannot represent.
Model selection prioritized:
- Stability across validation splits
- Ability to handle sparse, tabular data
- Support for per-instance attribution signals
6. Model Choice and Evaluation Philosophy
Gradient-boosted decision trees were selected as the final modeling approach due to their strong performance on structured data and their ability to provide feature attribution at the individual prediction level.
Evaluation focused on:
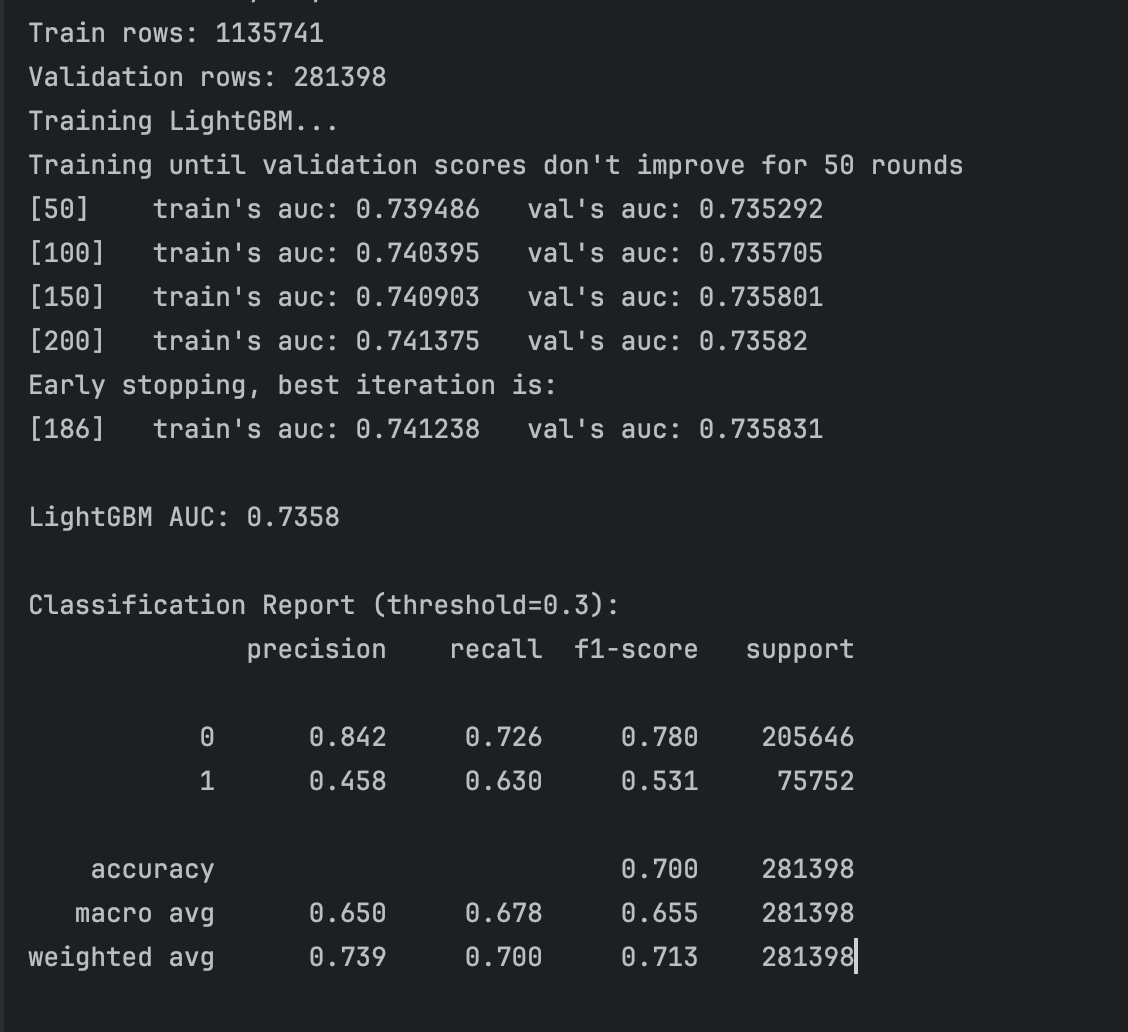
- ROC-AUC as a measure of ranking quality
- Precision–recall trade-offs under different thresholds
- The behavior of the model across low- and high-confidence predictions
Accuracy alone was not emphasized, as the class distribution and business context make probabilistic ranking more relevant than strict classification.
7. Interpreting Predictions at the Decision Level
Rather than stopping at global feature importance, the focus shifted to per-prediction explanations.
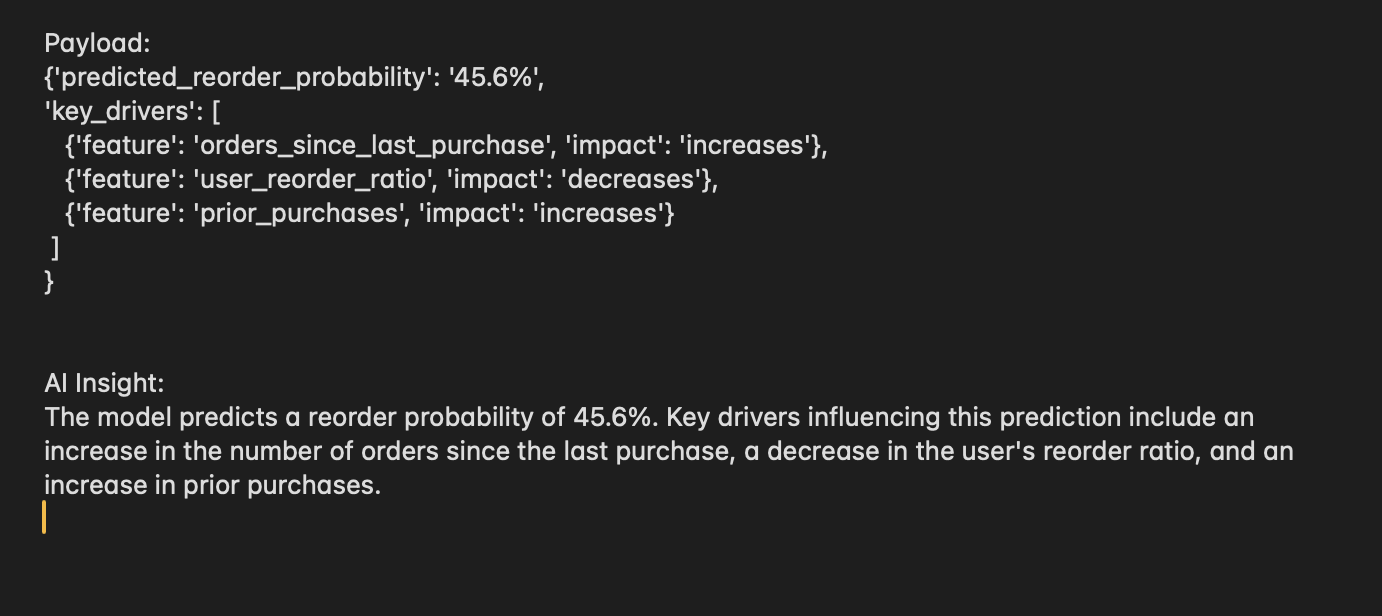
For each prediction, the model produces attribution signals indicating which features pushed the prediction higher or lower relative to the baseline. These signals are statistical in nature and describe model behavior, not causality.
This level of interpretability is critical when predictions are used to support operational decisions rather than offline analysis.
8. Integrating an AI Interpretation Layer
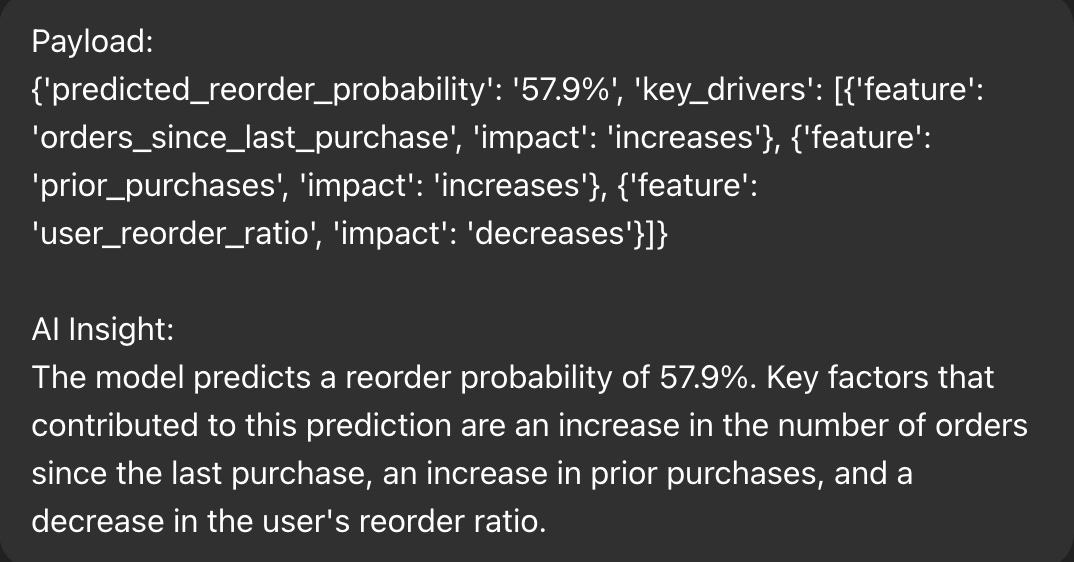
While model attributions are informative, they are not always easily digestible by non-technical stakeholders. To address this, a constrained language model was introduced to translate attribution signals into short, neutral explanations.
The AI layer was deliberately limited:
- It does not generate predictions
- It does not provide recommendations
- It does not infer causality
- It only summarizes model signals already computed
This preserves analytical integrity while improving accessibility.
9. System-Level Perspective
The final system is best understood as a pipeline:
- SQL-based feature construction at scale
- Supervised machine learning for probabilistic prediction
- Attribution-based interpretability at the individual level
- AI-assisted explanation constrained to model outputs
Each component serves a specific role, and no single part attempts to solve the entire problem alone.
10. Reflection on Trade-Offs
Several trade-offs were made deliberately:
- Interpretability over maximum complexity
- SQL-first processing over notebook convenience
- Local LLM inference over external APIs
- Clear separation between prediction and explanation
These decisions favor reliability, transparency, and realism over novelty.
11. Mental Model Behind the Project
The guiding mental loop throughout the project was:
- Observe behavior
- Summarize history
- Predict likelihood
- Explain signals
This loop mirrors how real-world data products operate, where trust and clarity are as important as predictive performance.
Problem Definition
Predicting product reorders in large-scale e-commerce systems is challenging because customer purchasing behavior is highly variable, context-dependent, and sparsely observed at the individual product level. The problem requires modeling millions of user–product interactions while avoiding data leakage, handling class imbalance, and producing predictions that are not only accurate but interpretable at the level of individual decisions.
Dataset & Data Construction
This project is built on the Instacart Market Basket Analysis dataset, which contains tens of millions of order–product interactions across users, products, and time. Rather than modeling directly on raw transactional tables, the data was restructured into a modeling-ready format through a series of intermediate aggregation steps.
The raw dataset is highly normalized and optimized for transactional storage, not predictive modeling. A single reorder decision is distributed across multiple tables, making it unsuitable for direct use without careful restructuring.
- orders — order-level metadata including user, order sequence, and timing
- order_products__prior — historical product purchases per order
- order_products__train — labeled reorder outcomes for supervision
- products — product identifiers and metadata
- aisles / departments — product taxonomy
To support scalable modeling, several intermediate tables were constructed to summarize historical behavior at the user–product level. All feature engineering was performed in SQL to ensure performance, transparency, and strict temporal control.
- User–Product History Table — aggregates prior purchase counts and recency signals for each user–product pair
- User Behavior Summary Table — captures overall user reorder tendencies across all products
- Product Reorder Statistics Table — summarizes global reorder frequency per product
- Model Dataset Table — a denormalized table combining all features with a binary reorder target
Special care was taken to preserve temporal integrity. All features were derived strictly from historical orders that occurred before the prediction point, ensuring that no future information leaked into the training data.
- Order sequence numbers were used to separate past behavior from future outcomes
- Aggregations explicitly excluded the order being predicted
- User-based train/validation splits prevented cross-user leakage
Why this matters: The predictive power of the model is driven primarily by how historical behavior is summarized. The majority of the project’s complexity lies in data modeling rather than algorithm selection.
Modeling & Evaluation
Multiple models were evaluated, starting with logistic regression as a baseline and progressing to gradient-boosted trees for improved non-linear learning.
LightGBM was selected as the final model due to its balance of performance, stability, and ability to generate per-instance attribution signals.
AI-Assisted Insights
Model outputs are translated into concise, executive-readable explanations using a local large language model (Mistral via Ollama).
The LLM does not generate predictions or recommendations. It is strictly used to interpret model signals, following explicit constraints to avoid hallucination, causal claims, or business advice.
Reflection & Learnings
This project demonstrated how large-scale transactional data can be transformed into actionable, interpretable predictions when modeling, data engineering, and system design are treated as a single workflow rather than isolated steps.
Key Takeaway: Predictive models deliver the most value when their outputs can be clearly explained, trusted, and consumed within real decision contexts.